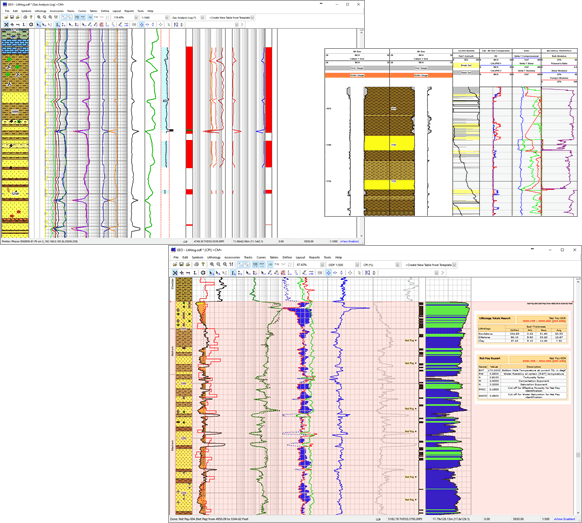
Generate quick-look petrophysics, characterise formation fluid, chart well trajectory and automatically highlight washouts and obtain SHmax.
The GEOSUITE provides a host of easy to use analytical tools. Automate them in your Template for maximum utility
Graphs
The graphing tool is a very versatile app. It can be used as a stand alone program or within a log to present a range of analyses.
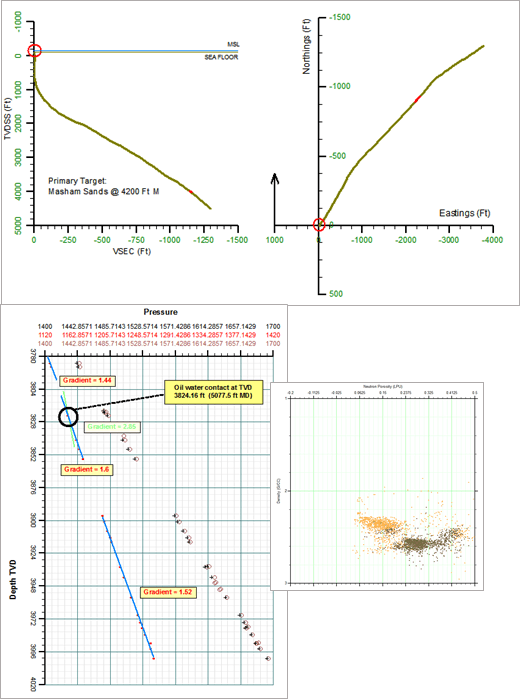
Trajectory
The well trajectory can be displayed in northings vs eastings and TVD vs VSEC in either the header or trailer of your log. This plot can be automatically created by simply loading survey data (INC/AZI).
Cross-plots
A staple of any geoscientists work. Cross plot 2 data sets to understand their inter-relationship. Add a 3rd parameter via the Z-plot feature.
Calculations
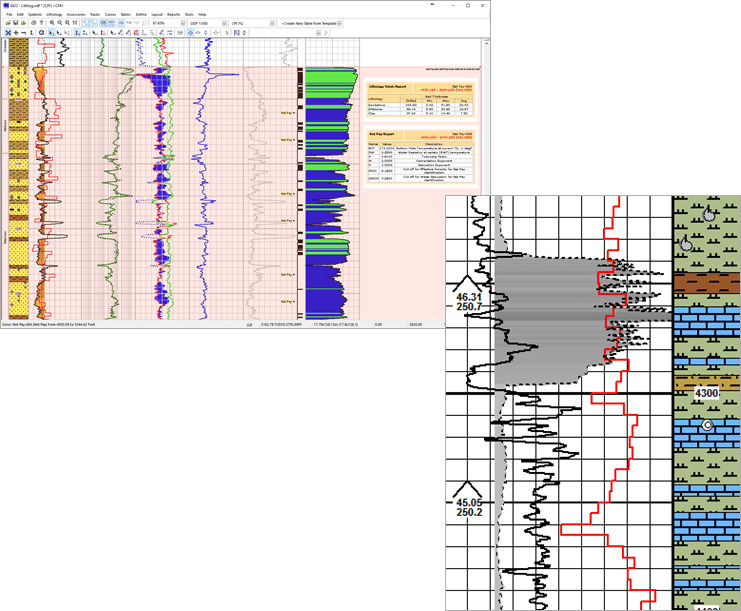
Use recognised methods to analyse data in real-time, such as Gas ratios for formation fluid evaluation, Borehole ovalization for stress indicators and quick-look petrophysical equations for target identification.
A pre-configured suite of expressions are included in off-the-shelf templates, or you may create and customise them for your own region or environment.
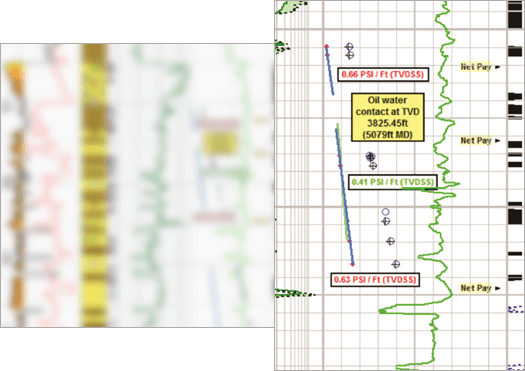
Trendline
Trend any curve or tabular data set to derive a gradient or line equation. Particularly useful for formation pressure tests and normal compaction trending for pore pressure studies.
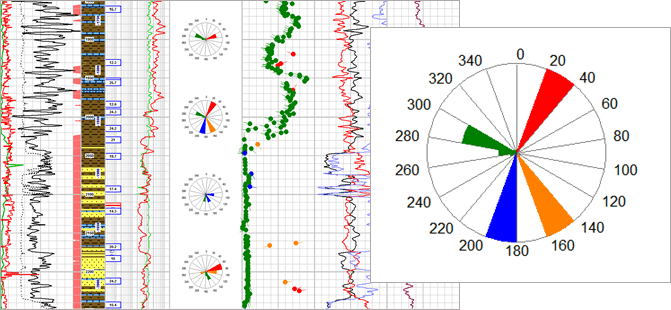
Rose Plots
Any directional data can be represented in rose plots. This can be used to interpret fractures or understand borehole ovalization direction.
Shading
Shade areas between curves, shade from a fixed point to the curve and set graded shades both horizontally and vertically.
Shade a track based on the sample colour from Chromastratigraphy, display gas effect, highlight gas peaks and wash-outs. Key operational issues highlighted with a simple tool.
Zones
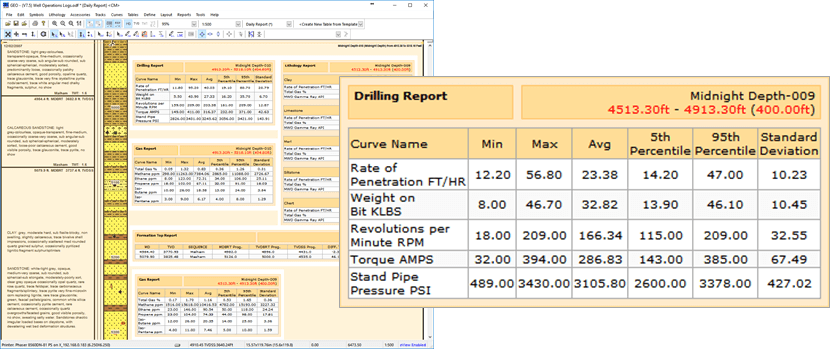
During drilling operations, create zonal reports to capture key data statistics like Depth Drilled per Day, Gas averages within a Formation and Drilled thickness of Sandstone.
This information can be access by simply dragging a visual zone on your log, during a morning call or while gathering data for the daily report.